平台目前已经集成了echarts5.3.2,可以全量导入,打包后的组件已经排除,发布到平台会自动引用平台库。
1.效果展示
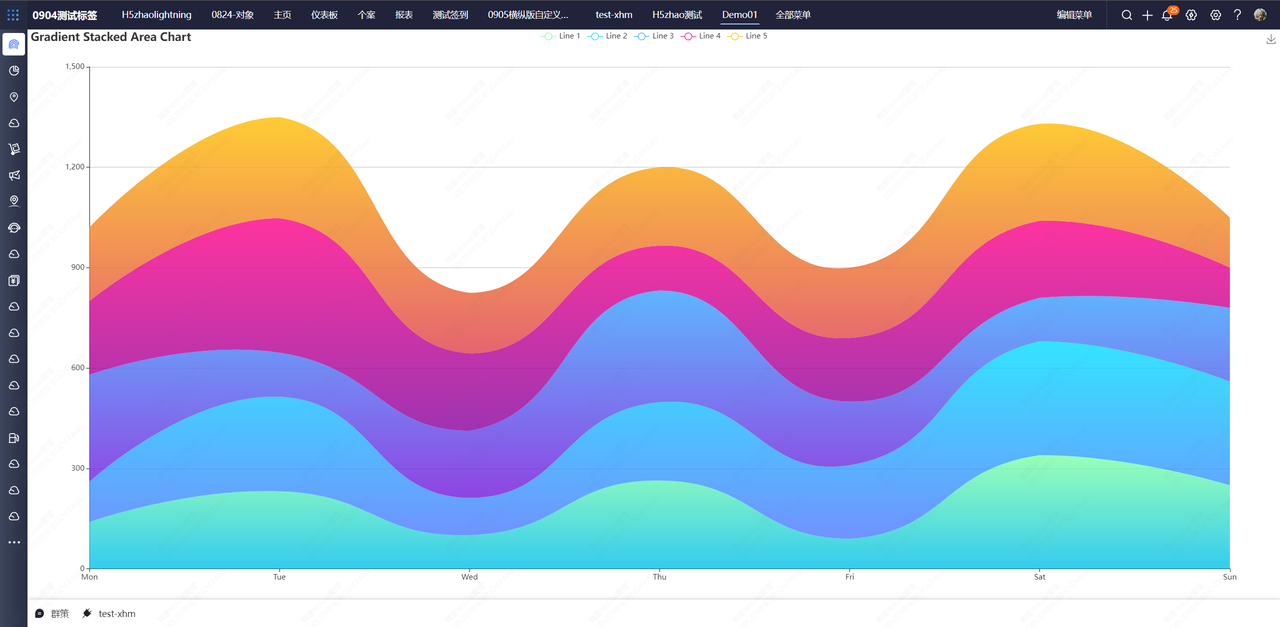
2.代码实现
<template>
  <div id="chartId" :style="{ width: '100%', height: '400px' }"></div>
</template>

<script>
import * as echarts from "echarts";
export default {
  data() {
    return {
      componentInfo: {
        // 组件唯一标识,全局唯一
        component: "cloudcc-demo-a",
        // 组件名称,在页面编辑器显示的名字
        compName: "cloudcc-demo-a",
        // 组件描述信息
        compDesc: "组件描述信息",
      },
      isLock: false,
    };
  },
  mounted() {
    this.myChart = echarts.init(document.getElementById("chartId"));
    // 绘制图表
    this.myChart.setOption({
      color: ["#80FFA5", "#00DDFF", "#37A2FF", "#FF0087", "#FFBF00"],
      title: {
        text: "Gradient Stacked Area Chart",
      },
      tooltip: {
        trigger: "axis",
        axisPointer: {
          type: "cross",
          label: {
            backgroundColor: "#6a7985",
          },
        },
      },
      legend: {
        data: ["Line 1", "Line 2", "Line 3", "Line 4", "Line 5"],
      },
      toolbox: {
        feature: {
          saveAsImage: {},
        },
      },
      grid: {
        left: "3%",
        right: "4%",
        bottom: "3%",
        containLabel: true,
      },
      xAxis: [
        {
          type: "category",
          boundaryGap: false,
          data: ["Mon", "Tue", "Wed", "Thu", "Fri", "Sat", "Sun"],
        },
      ],
      yAxis: [
        {
          type: "value",
        },
      ],
      series: [
        {
          name: "Line 1",
          type: "line",
          stack: "Total",
          smooth: true,
          lineStyle: {
            width: 0,
          },
          showSymbol: false,
          areaStyle: {
            opacity: 0.8,
            color: new echarts.graphic.LinearGradient(0, 0, 0, 1, [
              {
                offset: 0,
                color: "rgb(128, 255, 165)",
              },
              {
                offset: 1,
                color: "rgb(1, 191, 236)",
              },
            ]),
          },
          emphasis: {
            focus: "series",
          },
          data: [140, 232, 101, 264, 90, 340, 250],
        },
        {
          name: "Line 2",
          type: "line",
          stack: "Total",
          smooth: true,
          lineStyle: {
            width: 0,
          },
          showSymbol: false,
          areaStyle: {
            opacity: 0.8,
            color: new echarts.graphic.LinearGradient(0, 0, 0, 1, [
              {
                offset: 0,
                color: "rgb(0, 221, 255)",
              },
              {
                offset: 1,
                color: "rgb(77, 119, 255)",
              },
            ]),
          },
          emphasis: {
            focus: "series",
          },
          data: [120, 282, 111, 234, 220, 340, 310],
        },
        {
          name: "Line 3",
          type: "line",
          stack: "Total",
          smooth: true,
          lineStyle: {
            width: 0,
          },
          showSymbol: false,
          areaStyle: {
            opacity: 0.8,
            color: new echarts.graphic.LinearGradient(0, 0, 0, 1, [
              {
                offset: 0,
                color: "rgb(55, 162, 255)",
              },
              {
                offset: 1,
                color: "rgb(116, 21, 219)",
              },
            ]),
          },
          emphasis: {
            focus: "series",
          },
          data: [320, 132, 201, 334, 190, 130, 220],
        },
        {
          name: "Line 4",
          type: "line",
          stack: "Total",
          smooth: true,
          lineStyle: {
            width: 0,
          },
          showSymbol: false,
          areaStyle: {
            opacity: 0.8,
            color: new echarts.graphic.LinearGradient(0, 0, 0, 1, [
              {
                offset: 0,
                color: "rgb(255, 0, 135)",
              },
              {
                offset: 1,
                color: "rgb(135, 0, 157)",
              },
            ]),
          },
          emphasis: {
            focus: "series",
          },
          data: [220, 402, 231, 134, 190, 230, 120],
        },
        {
          name: "Line 5",
          type: "line",
          stack: "Total",
          smooth: true,
          lineStyle: {
            width: 0,
          },
          showSymbol: false,
          label: {
            show: true,
            position: "top",
          },
          areaStyle: {
            opacity: 0.8,
            color: new echarts.graphic.LinearGradient(0, 0, 0, 1, [
              {
                offset: 0,
                color: "rgb(255, 191, 0)",
              },
              {
                offset: 1,
                color: "rgb(224, 62, 76)",
              },
            ]),
          },
          emphasis: {
            focus: "series",
          },
          data: [220, 302, 181, 234, 210, 290, 150],
        },
      ],
    });
  },
};
</script>
<style lang="scss" scoped>
.cc-container {
  text-align: center;
  padding: 8px;
  background: goldenrod;
}
</style>